|
 |
GoldenEye 007 Nintendo 64 Community, GoldenEye X, Nintendo 64 Games Discussion
GoldenEye Cheats, GoldenEye X Codes, Tips, Help, Nintendo 64 Gaming Community
|
|
|
|
|
|
|
|
|
|
|
Dragonsbrethren
Hacker


Joined: 23 Mar 2007
Posts: 3058
|
 Posted: Sun Feb 17, 2013 2:03 pm Post subject: Posted: Sun Feb 17, 2013 2:03 pm Post subject: |
  |
|
| Hey Zoinkity, any plans to get back to these some day? I completely forgot about this thread, so rereading all of this has been great. Hope you dig into PD's menu once we get those beta ROMs, too. |
|
| |
|
|
|
|
|
|
|
|
zoinkity
007

Joined: 24 Nov 2005
Posts: 1757
|
| Posted: Sun Feb 17, 2013 8:16 pm Post subject: |
|
|
Sorry, forgot about it ;*)
Wow! It's been three years?
The tile debugger is interesting. That's the one mentioned a few posts ago. It basically tells you details such as the color, positions, and connectivity of the current and adjacent tiles.
I mention that since the XBox PD rehash as a full display for its tile debugger, but it's a bit more likely if PD still has the feature it will work more like this.
_________________
(\_/) Beware
(O.o) ze
(> <) Hoppentruppen! |
|
| |
|
|
|
|
|
|
|
|
Dragonsbrethren
Hacker
Joined: 23 Mar 2007
Posts: 3058
|
| Posted: Sun Feb 17, 2013 9:24 pm Post subject: |
|
|
| zoinkity wrote: | | Wow! It's been three years? |
Tell me about it. 
| zoinkity wrote: | The tile debugger is interesting. That's the one mentioned a few posts ago. It basically tells you details such as the color, positions, and connectivity of the current and adjacent tiles.
I mention that since the XBox PD rehash as a full display for its tile debugger, but it's a bit more likely if PD still has the feature it will work more like this. |
Interesting. I wouldn't have expected them to put any real effort into new debugging features in the XBLA version, not related to their additions anyway. I guess improved tile display would have been nice for making sure the tiles matched up with any minor background changes they made. I was surprised to see PD's (well, 4J's) pads display was just flat squares. I would've figured they'd at least show sizing information. Guess the editor spoiled me, hard to believe the original devs had so little to work with. |
|
| |
|
|
|
|
|
|
|
|
zoinkity
007
Joined: 24 Nov 2005
Posts: 1757
|
| Posted: Mon Feb 18, 2013 5:06 am Post subject: |
|
|
Well, it does sort of make sense to upgrade. The original debugging tools were designed for a different PC interface. Sure, printed text might tell you the same thing, but how exactly do you pipe it to PC? Making it more user-friendly also means less background reading for the debugging crew.
Chances are most of the debug threads' code in XBox is brand new.
Did they close off any of the known bugs? Especially interested in those MP pitfall tiles (Skedar Ruins door frame, for instance).
_________________
(\_/) Beware
(O.o) ze
(> <) Hoppentruppen! |
|
| |
|
|
|
|
|
|
|
|
Dragonsbrethren
Hacker
Joined: 23 Mar 2007
Posts: 3058
|
| Posted: Mon Feb 18, 2013 12:05 pm Post subject: |
|
|
I never thought to try the door frame in Ruins. Truth be told I haven't played much multiplayer on the XBLA version; online is dead, I've already played the original game's multiplayer to death offline, and if I've actually got friends around who want to play I'd rather it be on a good map.
The bug with the door on dataDyne Central's rooftop is still there, where you let the guard open it, stand on it, and walk through the wall, allowing for ridiculously short Agent times in Defection. Other than that, I don't really know of any. |
|
| |
|
|
|
|
|
|
|
|
Trevor
007

Joined: 15 Jan 2010
Posts: 926
Location: UK, Friockheim OS:Win11-Dev PerfectGold:Latest
|
| Posted: Wed Mar 09, 2016 4:04 am Post subject: |
|
|
Another 3 years hahaha
Anyway, sub linked to the thread and I thought I might as well share some info and hopefully get corrections if Im wrong.
It is unfortunate that show mem use is gutted, that is a really usefull tool.
I think I know what information Display Speed provides.

The bars are "Chunked" by frames
If a bar crosses a mark then it takes another frame to complete.
If a bar is 3.2 marks long it takes 4 frames to complete etc
| Code: |
|==== || | | | | |
||====== | | | | | |
|=========|=== | | | | |
utz 99 30hz
rsp 0 2 frames
tex 1
|=========||=======|==== | | | |
|| |===== || | | | |
| |========|== | | | |
utz 90 30hz
rsp 9 2 frames(3)
tex 1
Chucking Knives into the abyse (Causing sound to stop)
|=========||||=====|========||||=====|========||||= |
||||==== | |||| | |||| | |
| ======|== | | | | |
utz 88 10hz
rsp 3 6 frames
tex 9
|
First bar (red) - RSP Time, Converting DLists into DPLists.
First Bar (blue)- Audio RSP (always low, max 1/4 frame)
Second Bar (red) - RDP CMD time (without stalling)
Second Bar (blue) - Audio RSP (always low, max 1/4 frame)
Third Bar - RDP render time (always higher than bar 2)
The blue bars are always staggered. If the top starts on frame0 the second will start of frame1 and the top will restart on frame2 etc.
likewise, if the second bar starts on frame0 the top bar will start frame1.
hz = FPS
Frames = number(BNumber)
Whole frames to complete, same as marks on bar graph
Bracketed number refers to frames for graphics only with leading frame idle
eg: 2(3) is, 3 frames to complete but graphics alone was 2frames (30fps), leading frame was idle waiting for RSP.
Bracket number will be converted to actual number if that state excedes 1 frame (since its no longer able to complete within the lower number of frames)
utz xx% = RSP Utilisation, Ideally should be 100%
rsp xx% = RSP Stall, waiting on commands from CPU. Usually very low (3%)
tex xx% = TMEM - Usually low (5%) therefore must be Delay not size.
UTZ should be 100%, If the RSP has to wait on DMA transferes it is Stalled and the time (percentage per frame) is indicated as RSP or TMEM.
This explains why when a guard first appears the RSP count goes high then low again.
Same for textures. The more textures on-screen, the longer the delay waiting for DMA from RAM to TMEM.
Other Examples:
Mario
Mario uses a similar kind of speed bar (The cutting room floor)
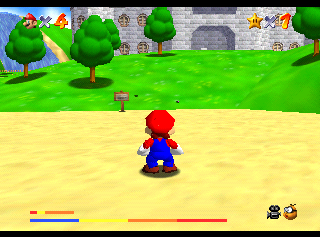
where the audio bars are staggered accross the top 2 bars.
The third bar (the lowest and longest bar in screenshot (1 bar is missing from emu) ) is the frame marker and does not move.
Also of note is that TCRF have incorrectly called is the sound bar. it is not and instead shows the SP processing times for both Audio and Grapics as well as the DP render time.
nuDebTaskPerfBar1
Below is an Example from CCBL showing longer render time but less idle
| Code: |
|frame -1 |frame 1 |frame 2 |frame 3
---------------------------------------------------------
(1) RSP | | | | |
(2) RSP |=============|======== | | |
(3) RDP |=============|=============|===== | |
(4) CMD |=============|=============|====== | |
(5) PIPE|=============|=============|======= | |
(6) TMEM|== | | | |
-------------------------------------------------------- |
(1) RSP's time processing audio task (black)
(2) RSP's time processing graphics task (yellow) (includes yield time)
(3) RDP's time drawing graphics (green)
(4) CMD counter value of RDP's internal counter
This is the process execution time. Unlike (3) it does not include the time waiting for commands from the RSP. When this bar is shorter than bar (3) it means that time is being spent waiting for commands from the RSP.
This counter is incremented once every clock cycle when the RDP has work to do. The RSP places RDP commands in a FIFO for execution. If this FIFO is not empty, the counter is incremented.
(5) RDP's PIPE counter value
This counter is incremented when the internal RDP pipeline is not stalled while waiting for memory accesses to occur.
(6) RDP's TMEM counter value
This value represents the time required for loading to texture memory. The performance is better if this value is small.
Trev
_________________
   |
|
| |
|
|
|
|
|
|
|
|
Synth man
Agent

Joined: 12 Oct 2019
Posts: 3
|
| Posted: Sat Oct 12, 2019 7:54 am Post subject: Return to game/ clear master cheat menu screen |
|
|
How do you clear the master cheat menu off the game screen? I have used items and they work great but I can not clear the jumbled text off the game play screen without disabling the cheats and use of control buttons.
_________________
Synth man!!! |
|
| |
|
|
|
|
|
|
|
|
zoinkity
007
Joined: 24 Nov 2005
Posts: 1757
|
| Posted: Mon Feb 23, 2026 12:47 pm Post subject: |
|
|
To answer your question seven years too late, press Start to close the interface.
After forgetting about this topic for...a decade and a half? (aegh...) here's the final handful of entries, in order of usefulness. Who would have guessed "port close/inf/approx" actually works!?
"intro pos"
A "do-nothing" remnant of what it was. In its current form it grabs the player's position and horizontal rotation.
The position is completely thrown away. The rotation value is corrected (2? - deg), then converted to its cosine and sine twice. None of these values are used.
The second set of conversions were probably meant for a different value unless one was displayed on screen and the other printed to stderr.
Safe to say it printed that location data. Was it to screen? Was it to devkit or stderr? Who knows.
"explosion info"
Its sole caller is 7F04B610(), responsible for generating trash when you blow up a normal object. There's obviously removed logic, but what makes things interesting is that it actually sort of works.
The poorly-named "object explosion details" are kept in 0xE sized entries at 8003B224~8003C4D0. These are used when an exploded object is re/destroyed; shoot a burned out box, it will trip 7F04CE50 and this function.
If the halfword read from the obj. explosion entry is zero (which block in the entry is randomly selected), it uses a random value instead.
In its current form, when the debug flag is set it always uses a random value, ignoring the data pulled from the entries. Basically, an override.
There's an extra, unused flag read before calling rand(). It's pretty clear it did something here, and that something probably spat out what entry and value was used, but it's long gone.
In summary:
When active (flag or zero value), it rechecks if the flag was set, then grabs a random value.
It then checks the flag again, and if set will reduce the random value to 16 bits.
That replaces the value from the explosion entry when calling 7F09B788() later on.
In that regard you could say this debug feature is broken but usable.
Still, it doesn't have a cool interface like the next entry...
port close/inf/approx
Actually useful. All three options were merged together. Activating any option enables the portal edit interface.
The handler for this feature, 7F0BDF10(), has two different modes. When handed a display list pointer, it attempts to print the current portal index (at 800483CC) to a removed debug printer, and if A is pressed on either controller 1 or controller 2, also writes it to the debug port.
When not in print mode, this function acts as an interface. Unlike the printers, this part is completely functional. Button combos can be used on either controller 1 or 2 with a single exception, noted below.
+ Left pressed:
Decrement the portal index (800483CC). The index won't go below zero.
+ Right pressed:
Increment the portal index (800483CC). There's no limit to the index so you could, well, overflow.
Hold L+R, + Down pressed on controller 1:
Switch parent/child room numbers for the current portal.
Hold R, + Down pressed:
Set "closed" flag (01) in the current portal's 6th byte.
Hold R, + Up pressed:
Clear "closed" flag (01) in the current portal's 6th byte.
This flag is normally set when a door is closed and cleared when the door is open. It obscures the area behind the portal.
Hold L, + Down pressed:
Clear flag 02 in the current portal's 6th byte.
Hold L, + Up pressed:
Set flag 02 in the current portal's 6th byte.
This flag is a special-case when the portal is active. It switches from the normal line-of-sight one that's room-based; "inf" probably refers to infinite depth. To summarize, 7F0B7F84() is called with a room number and whichever room in the portal this isn't, that's the room used for calculation.
One difference between the two modes applies to when the "approx" feature is active. You'll have a sort of deadzone at the fuzzy edge when passing through. Basically, the test will fail and return. You shouldn't be able to see this...but that's also why this debugger exists ;*)
+ Down pressed:
Decrement the counter nybble of the current portal's 7th byte (approx).
+ Up pressed:
Increment the counter nybble of the current portal's 7th byte.
These are the "approx" value, a sort of fudge factor. Portals at funny angles or extreme scale may set this to change their sensitivity from precise planes to muddy blobs.
Minus the very real problem of the current portal number not being displayed, this feature works quite well.
...That technically covers all of MCM, but considering a sort of afterward. Shouldn't take more than a decade to remember to update ;*)
Might be a good idea to find new hosts for the referenced files like those ramrom recorder patches...
_________________
(\_/) Beware
(O.o) ze
(> <) Hoppentruppen! |
|
| |
|
|
|
|
|
|
|
|
zoinkity
007
Joined: 24 Nov 2005
Posts: 1757
|
| Posted: Wed Jul 15, 2026 1:02 pm Post subject: |
|
|
.: "Testing error", or "How we missed debug features in plain sight" :.
The debug code, aka MCM, is rather simple.
| Code: | 81036F6C 0000
81036F6E 0002
D0064F31 000C
80024303 0001 |
Problem is, the first two lines of that code is bugged! 80036F6C matches the selected option on the MCM (debug menu)!
7F090F20() copies the debug menu selection (80036F70) to this address (80036F6C). This is picked up later during play to enable the interfaces for these options.
<edit> ...and it turns out 7F090F20() isn't called. The debug interface does copy the value back from 80036F6C to 80036F70 before resetting the interface to -2, and it sets it to -2 when you move on the menu, but the feature to copy the selection isn't called. So those below both do and don't work naturally. I'll leave the rest of the message unedited though, out of laziness.
We didn't notice this behavior because the GS codes for displaying MCM set 80036F6E to 2 constantly. That was done so the normal player interface would continue working.
We like to think of the debug menu as a standalone, separate thing from gameplay but it's quite the opposite. The NTSC versions are more debug versions than a final commercial product (especially when it comes to file loading). The "bond view" option is normal gameplay. In normal interaction mode (80036F68 == 2 or -2) the game must be set to "bond view" (80036F6C == 2) or the default -2 for button input to be read. Selecting other options only let you use the control stick and whatever buttons those options directly read. Likewise, "stan view" was tied to its mode (1, which is a stub), and the free camera is tied to "move view" and...
3B "intro edit"
This utilizes the same code that the free camera does. If "intro edit" is active, 80036ABC is < 0, and interaction is off (80036F68 set to control mode 0), this provides free camera support.
Otherwise, there doesn't appear to be any active code and doesn't exactly set everything up correctly. Originally this would have spit out the camera location, then you'd copy it and a dozen others like it into the setup file.
What makes it unique is this is the only option that shares a full interactive mode with another option. Otherwise, pretty useless ;*)
Now onto things that actually work!
(Like all good clickbait, the best one is the one at the end.)
.: These can be used pretty much anytime the screen is being drawn :.
0C MCM "music" option
This test uses only the primary music track, the not atmospheric or xthemes.
On the main menus, the "current track number" isn't actually set so the list will start at 0 (no music). The total tracks are hardcoded. Just before its dedicated functions is an unused function that would randomly-select a music track between 2 and 3E. (0 is silence and 1 is the death theme.)
Press + Left or C Left:
Play previous music track (these wrap from 3F to 1)
Press + Right or C Right:
Play next music track
Press + Down:
Stop music
Press B Button:
Set the track's default volume to the current master volume setting.
0D MCM "sfx" option
Very similar to the music debug, also using hardcoded total entries in dedicated functions.
Press + Down, + Left, L Button, or C Left:
Play previous SFX.
Press + Up, + Right, R Button, or C Right:
Play next SFX.
Press C Down:
Unknown; calls 70009124() Might be forcing mono vs stereo?
Press C Up:
Replay current SFX.
38 MCM "screen pos" option
Moves the screen, but some graphics plugins don't emulate this.
Hold C Down:
Increase xpos screen offset.
Hold C Up:
Decrease xpos screen offset.
Hold C Right:
Increase ypos screen offset.
Hold C Left:
Decrease ypos screen offset.
.: These can only be used during active gameplay :.
04 MCM "region" option
Sadly, all of the functions called are now stubs. The region select one was in the stan function range.
Both call the same, removed camera function 7F0B2D38() used by "stan view". In this case player input isn't provided to it though. The "stan view" feature sends it your stick's horizontal pos, vertical pos, and button input. In this case all values are zero.
Press C Left:
(removed) Selected the previous region calling 7F0AF630(-1).
Press C Right:
(removed) Selected the next region calling 7F0AF630(1).
08 MCM "select anim" option
Uses actor animations from the 80029D6C table. 8002C908 is the cur. animation, 8002C90C a flag to autoplay animations, and 8002C910 another flag used to play them manually. 8002C904 is automatically set True when this is the interface mode, enabling the global animation override.
Players will only show the first frame of the animation. They won't play the rest. Guards--all of them simultaneously--will play the entire animation through unless you press the L Button to set animations to manual mode. Gunfire, thrown things, and any other interaction types don't occur.
Very, very, very cool ;*)
Press C Left:
Set previous animation.
Press C Right:
Set next animation.
Press L Button:
Toggles the 8002C90C flag. When False, animations play automatically. If True, the animation loads and waits for the player to...
Hold R Button:
Plays the animation while the button is held. Only read when 8002C90C above is set in manual mode. Sets 8002C910 True when held, else False. |
|
| |
|
|
|
|
|
|
|
|
|
|
|
|
|
|
You cannot post new topics in this forum
You cannot reply to topics in this forum
You cannot edit your posts in this forum
You cannot delete your posts in this forum
You cannot vote in polls in this forum
|
|
|
|